
The start of a new quarter is always a mix of excitement and uncertainty for B2B Tech / B2B SaaS companies. A lot can happen in the weeks ahead—new opportunities will emerge, deals that seemed promising might stall, and fresh challenges could arise. Yet, despite these unknowns, sales leaders are tasked with producing a first forecast. This initial prediction needs to be both high-level and relevant, even when a lot of information is unknown.
How do you make this forecast as accurate and actionable as possible? By focusing on key performance indicators (KPIs) that provide a data-driven foundation for your predictions. Here are the five KPIs to examine for a reliable sales forecast beginning of quarter in B2B Tech / B2B SaaS.
Exec Summary
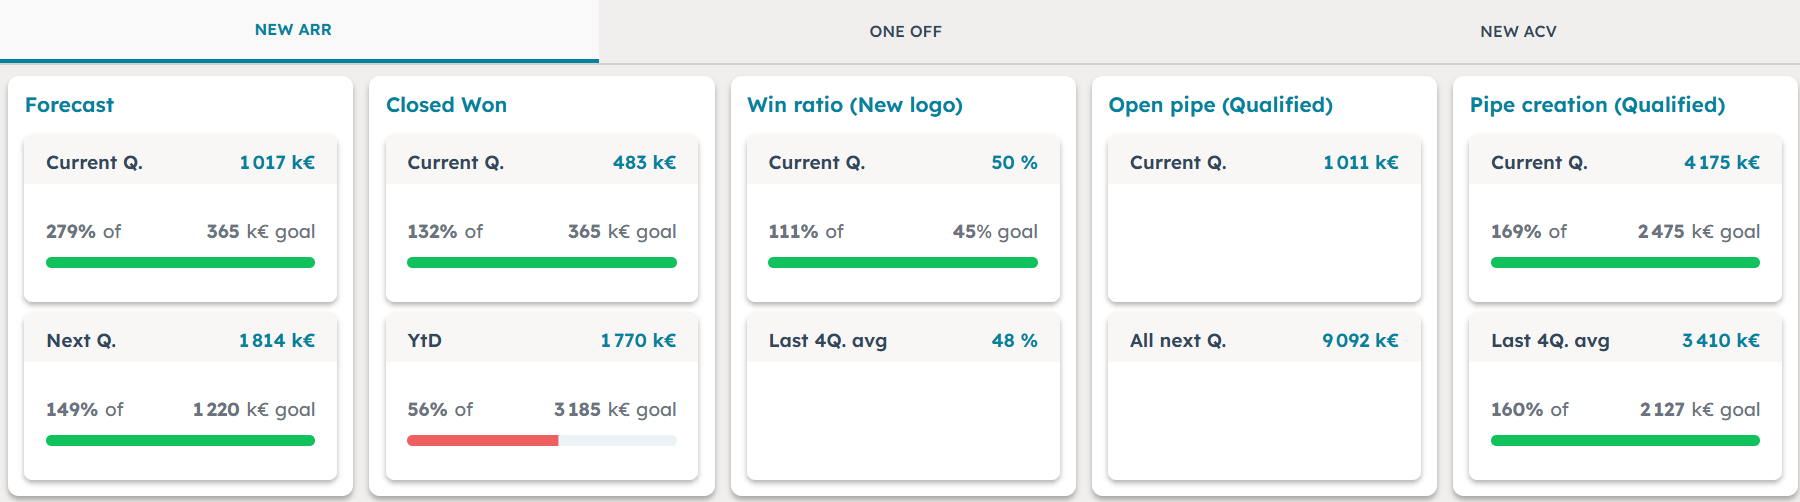
In this article, we’ll explore 5 KPIs to look at, and the actions to undertake, in order to produce an actionable forecast that reflects both historical patterns and real-time insights:
- weighted and unweighted open pipe to understand the quality of your pipe
- win and abandon ratio to understand how much you can close
- intra quarter closing and pipe creation to understand how much is potentially going to appear into the quarter
- beginning vs end comparison to understand the overall dynamics of your past quarters.
Think about differentiating New vs Existing, and potentially looking separately at key dimensions such as SMB vs Enterprise. Never forget that you can’t look at one KPI standalone, and only by analyzing the different numbers will you gain a full understanding of where you stand to start your quarter.
1. Weighted & Unweighted Open Pipeline
Why This Matters
For sure, your open pipeline for your new quarter is where to start. It will give you your coverage ratio—essentially, the ratio between your pipeline and your quarterly sales target. But don’t stop at this number! The quality and cleanliness of the pipeline are critical, as a bloated pipeline full of unlikely-to-close deals gives a false sense of security. Look at two numbers:
- Unweighted Open Pipeline: The total value of all deals closable in the quarter, without applying any probability based on deal stages or forecast categories.
- Weighted Open Pipeline: The total value of deals adjusted by their likelihood of closing, based on your day-to-day sales forecasting process. Weighted pipeline gives you the quality of your pipe on day one of the quarter.
Action
Analyzing your pipeline is good, but only if your pipeline is clean. Don’t wait until the new quarter has begun to start cleaning your pipe. Even if your teams are focused on closing the quarter that ends, enter the quarter with a clean pipe so that you don’t waste your first two weeks working with incorrect data:
- Remove stalled deals: Deals that have been pushed multiple times from one quarter to another are probably dead deals. It’s time to kill them so that they don’t bias your open pipe.
- Check top deals: For deals that represent a significant part of your pipe, challenge whether they are indeed closable in the quarter. Ensure they are correctly positioned, with the correct deal amount and the right forecast category. (See our article Sales Forecasting in B2B Tech / B2B SaaS: Move away from activity based forecasting to get accurate numbers)
Everybody has in mind the magic 3x ratio! But this ratio alone is not enough if your qualification process is flawed and/or if other KPIs are below or above market practice.
2. Win & Abandon Ratio
Why This Matters
Now that you have your open pipe, you need to evaluate how much you are going to convert. Look at how your team has historically performed to set realistic expectations for the new quarter. Look separately at Win Ratio (deals won / deals won + lost) vs Abandon Ratio (deals abandoned by the customer because they are not ready to enter a buying cycle).
Action
Analyze these ratios over different timeframes so that you can make the right assumptions for this quarter, based on both average values and recent trends:
- Last quarter (Q-1): Provides immediate context for how your team has been performing recently.
- Last 4 quarters average: Smooths out anomalies and gives a more stable benchmark and trend.
3. Intra-Quarter Closing Percentage
Why This Matters
For many B2B Tech / B2B SaaS companies, particularly those serving SMBs or mid-market clients, a significant percentage of revenue comes from fast-moving deals. The intra-quarter closing percentage measures the proportion of your bookings created and closed within the same quarter. This KPI reveals how much new business your team typically sources and converts during the quarter itself, beyond the pipeline already open at the start. It provides an additional layer of predictability and helps you understand how much you can rely on new opportunities versus existing pipeline.
Action
Examine your historical data on this KPI, not just for the last quarter, as it’s typically a more volatile metric than others. Identify any seasonal effects that you may need to factor in.
4. Pipeline Creation
Why This Matters
To correctly evaluate the contribution of your intra-quarter closings, you need to understand how your pipeline creation is trending. If you recently have a higher-than-usual pipeline creation rate, ensure these new deals are properly qualified so that other KPIs (e.g., time to closing, win ratio) can apply and you aren’t inflating your forecast.
Action
Look at pipeline creation over different timeframes and cautiously evaluate whether your sales and marketing initiatives could generate short-term pipeline:
- Last quarter (Q-1): Provides immediate context for how your pipeline creation has performed.
- Last 4Q average: Provides a more stable benchmark and trend.
- Sales & Marketing initiatives: Specific initiatives (e.g., product launch, marketing investment, company news) could positively impact your pipeline creation. Correlate this with intra-quarter closings to determine whether it’s short-term or medium-term pipeline.
5. Beginning vs End Comparison
Why This Matters
Now that you’ve worked out the math bottom-up, take a step back top-down! Take your open pipeline at the beginning of your new quarter, compare it with open pipeline at the beginning of past quarters, and see where previous quarters have landed to determine if your expected landing is consistent with historical results. While past performance doesn’t guarantee future results, sales performance rarely changes drastically overnight.
Action
Compare individually and globally:
- Unweighted open pipeline: Compare your current quarter’s unweighted open pipeline and coverage ratio with previous quarters to see if you are starting with better coverage.
- Weighted open pipeline: Compare your weighted open pipeline for this quarter with previous quarters to see if you are starting with a more qualified pipeline.
- Bookings comparison: Compare your bookings from previous quarters to your expected landing for this quarter to assess consistency with pipeline and coverage comparisons.
If your CRM or tooling supports it, perform this comparison on a weekly basis to monitor whether your quarter is progressing ahead of or behind previous quarters. (Also see how SnowLeopard Platform can help you better monitor your performance with weekly snapshots).
The Magic Formula
Now that you have your different KPIs, you can combine them to get a reliable sales forecast beginning of quarter:
Sales Forecast for New Quarter = Function of (Clean Open Pipeline, Win ratio, Abandon ratio) modulo (Open pipeline quality) + Intra-quarter pipeline creation modulo (Pipeline creation trend), corrected by (Beginning vs. End Forecast gaps for past quarters).
Adding Granularity, Moving Further
To make your forecast even more precise, consider segmenting your KPIs by deal type and customer segment:
- New vs. Existing Customers: Dynamics such as win ratios and intra-quarter closings often differ significantly between new customer acquisition and upselling or renewing existing accounts. By splitting your analysis, you can tailor your sales forecast to each group’s unique characteristics.
- SMB vs. Enterprise: If your business serves multiple segments, examine KPIs separately for small-to-medium businesses (SMBs) and enterprise customers. SMBs may have shorter sales cycles and higher intra-quarter closing rates, while enterprise deals might require longer, more complex engagements. Swing deals can also be game-changers for your forecast.
This granularity ensures that your sales forecast reflects the nuances of your market dynamics.
Conclusion: The Interconnected Nature of KPIs
At the beginning of the quarter, it might feel daunting to produce a forecast when so many variables are still unknown. However, it is absolutely possible to create a reliable forecast by focusing on data and trends. These provide a rational foundation for decision-making, even in the face of uncertainty.
By leveraging the five KPIs—open pipeline, win and abandon ratios, intra-quarter closings, pipeline creation trends, and current vs past quarter comparison—you can produce an actionable forecast that reflects both historical patterns and real-time insights.
It’s important to remember that these KPIs are not isolated metrics—they’re deeply interconnected, and you can’t analyze them separately. For example:
- The 3x pipeline coverage rule works only if your win ratio is strong (50% or higher) and your abandon ratio is low (30% or lower) (Struggling with your sales KPIs? Look at out KPI2Commit © masterclass).
- If you have a strong SMB business, the intra-quarter closing percentage is probably crucial.
- Gaps observed in beginning vs. end-of-quarter forecasts indicate how consistent your data is and whether it can be extrapolated.
By viewing these KPIs as part of a cohesive system, you can produce a forecast that is both realistic and actionable. This approach ensures your team is equipped to navigate uncertainties while laying the groundwork for a successful quarter ahead.
To continue exploring forecasting methodology, you can also read our article Sales forecasting in B2B Tech / B2B SaaS: Move away from activity based forecasting to get accurate numbers.
Discover our Forecast2Commit © Masterclass to build a sales forecasting playbook leveraging market practice
Agree or disagree with this article? Share your best practices!